accenture research
〰️
survey
〰️
accenture research 〰️ survey 〰️
When I wasn’t deep in the weeds of NLP models in Python, I spent my time @ Accenture working with the Human Insights Team on innovative survey practices. This ranged from research design and survey sample scoping to advanced analytics and reporting. I typically used Python, R, SPSS, and Power BI for survey analysis, and specialize in techniques like running regressions for inference and prediction, clustering, index building, and random forest modeling. In this role I was also focused on data visualization, communication and storyline development for published thought leadership. Here were some of my survey projects…
📆 year on year technology index
I built an additive index in R to measure technology adoption for industries and functions from 2021 to 2022. This served to highlight leading industries and functions, as well as laggards who represent an opportunity for technology growth.
⏰ innovation in survey methods
We partnered with CloudArmy (a neuroscience-meets-survey-execution company) to develop timed fast choice survey response questions - measuring the speed or conviction in respondents’ feelings toward technologies.
↗️ regressions at scale
We ran 10,000+ models using a tool I built to automate logistic regressions in R - enabling us to extract the key experiences that predict a customer’s likelihood to stay. The regression ouputs were all visualized in a Power BI app that automatically updated with new data.
📊 diagnostic for automatic insights
Built out of the regression results, we developed a diagnostic tool to inform client teams which experiences they should be leveraging given a company’s profile. To do this, we ran simulated predictions using the regressions models with certain control parameters (e.g. for different industries, functions, or markets).
✈️ a journey from survey to index
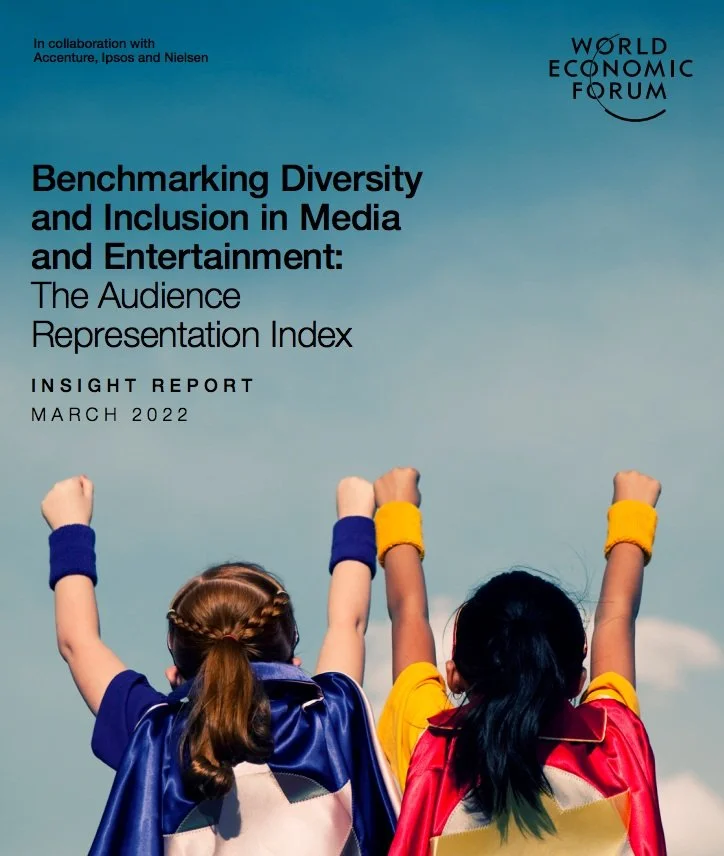
I led from survey scoping and questionnaire design through index development (once again, in R) for this project. In the end, we turned eight survey questions into a reproducible index with layered weightings to measure audience perceptions of diversity and inclusion in Media & Entertainment.
🤝 stakeholder management
This project was a collaboration between WEF, Accenture, Ipsos, and Nielsen. At every step of the way, we were leveraging (and balancing) data and input from all angles to arrive at a single, comprehensive index and report. Not a trivial task at all!
🌎 industry, function, and market insights
I led the development of tailored industry, function, and market insights from the initial survey data for this piece. These analyses formed the basis for 10+ break-off pieces from the global thought leadership.
⚖️ modeling operational maturity
For a follow-up to the initial piece, we ran linear regression models in R to pull out the capabilities (e.g. AI, Data, Talent) that are most necessary for organizations looking to advance their operational maturity. We also developed regressions to look at the potential synergies between these capabilities.


